Sunday, October 31, 2010

Dynamic Data Breakpoint

Tip - Putting dynamic data breakpoints.

Details -We know that there are two kinds of breakpoints. First is the code break point. The second type of break point is the data break point that can be set on variables. We can set a data break point on any (global, member and local) variables so that when it is read/written, the execution will be suspended. Usually data breakpoints are useful in detecting application crashes. In that, the crash occurs at one point and it might be due to an invalid memory access done at a different point in code. In this case we can put a dynamic data break point on the suspected variables.
When we are working with big systems, with hundreds of DLLs, it might not be practicable to put breakpoint by first attaching the required process to a debugger, break at some point and then put the code or data breakpoint. Also, the data might be allocated dynamically from a thread that is created at runtime. So it calls for dynamic breakpoints.
Both the code and data breakpoints can be set dynamically, without the help of a debugger. During runtime, when any one of these breakpoints is encountered, Windows OS will generate an Unhandled Win32 Exception.

How To -Code breakpoints can be dynamically set using the DebugBreak() API. The compiler will generate an int 3; assembly instruction.
The data breakpoints are set by the means of the context information of a thread. Apart from other things, the context contains debug registers. The number of data break points that can be set to a thread is limited by the number of debug registers available. We can also specify on what kind of access (read/write) it should break.
 In order to set a data breakpoint, following steps are done.
1.     Get the current thread context.
2.     Find the available register.
3.     Set the following information to the thread context.
(ア)             Starting memory address of the data.
(イ)             Number of bytes to be monitored for access.
(ウ)             Read/Write flag information. This is because we can tell whether to break on data read or data write. 1 for read and 3 for write.
(エ)             Set the enable/disable. 1 for enable and 0 for disable.
4.     Set the updated context.
The above steps will cause the breakpoint when the data is modified from a single thread.
What if the data is allocated from one thread and it is being accessed from different threads? In order to monitor a piece of data for read/write access from all the threads, we need to perform the above steps for each thread. One way to achieve this is to write a DLL and make use of the thread-attach notification.

Sample Implementation
The attached zip contains a DLL and a test application. The DLL exposes two APIs. One is to set the breakpoint and the other is to unset the breakpoint. During the set operation, it will update the current thread context and will keep the address, size etc inside a map. When the DLL receives a thread attaché notification, it will iterate the map and set the breakpoint for the new thread by updating its context information.


Sample application Download


References:
http://www.morearty.com/code/breakpoint

Posted By : Mohammed Nisamudheen S.


Thursday, October 28, 2010

Dr Watson Debugger

Tip - Dr. Watson for Windows is a program error debugger that gathers information about your computer when an error (or user-mode fault) occurs with a program.

Details - Dr Watson is a windows tool which automatically creates log and dump files when the application crashes. The Dr Watson error logs are useful for error diagnostics when no other particular log informations are not available. The dmp files available with Dr Watson can be analysed through debugging applications such as WinDbg.

By Default the error dumps of Dr Watson will be available at the path
C:\Documents and Settings\All Users\Application Data\Microsoft\Dr Watson\user.dmp

It is not necessary that Dr Watson is the default application that will be started when a application crash occurs. We can ensure the same using the Registry path HKEY_LOCAL_MACHINE\Software\Microsoft\Windows NT\CurrentVersion\AeDebug.

If the default debugger is not Dr Watson and you want to use Dr. Watson instead go to the command prompt and type the command drwtsn32 -i to start Dr. Watson. Typing -i causes the necessary changes to be made to the registry.

Interesting fact - The debugger is named after Doctor Watson of Sherlock Holmes fame, the idea being that it would collect error information following the problem. The original name of this tool was "Sherlock".

References - 

Posted By : Xavier K Joseph

Wednesday, October 27, 2010

Multithreading in OpenGL.

Tip - Since OpenGL maintains unique resource ID for each thread some special handling is required to use OpenGL in a multithread enviornment.

Details - In OpenGL we should have seperate context for each thread. And each context will keep seperate IDs for the resources created in its thread. Due to this the resources made in one thread will not be accessible in another thread. To avoid this limitation the contexts of the threads that we wish should be shared using the call wglShareLists. It should be cared that the context of the threads that we wish to share, shoud be shared before we make them the current context of individual threads. A simple example is given below.

Suppose we need to use OpenGL resources in Thread1 and Thread2.

unsigned int Thread1(LPVOID lpParam)
{
    HGLRC hThread1Context = wglCreateContext( hDC ); // hDC is the device context to which drawings should be done.
    HGLRC hThread2Context = wglCreateContext( hDC );
    // Share the context
   wglShareLists( hThread1Context, hThread2Context );
   wglMakeCurrent( hDC_i, hThread1Context )
}

unsigned int Thread2(LPVOID lpParam)
{
   wglMakeCurrent( hDC_i, hThread2Context )
}

Note:- It is seen that the CPU utilisation of the rendering applications goes higher when we share the contexts which uses same window DC for rendering. To avoid this issue it is recommended not to share contexts of the threads which uses same window. 

Posted By : Xavier K Joseph

Memory leak detection using _CrtSetAllocHook

Tip - We can use _CrtSetAllocHook function to monitor all the memory allocation and deallocation in an application. Please note that it will work only in debug mode.

Details - _CrtSetAllocHook allows an application to hook its own allocation function into the C run-time debug library memory allocation process. As a result, every call to a debug allocation function to allocate, reallocate, or free a memory block triggers a call to the application's hook function. _CrtSetAllocHook provides an application with an easy method for testing how the application handles insufficient memory situations, the ability to examine allocation patterns, and the opportunity to log allocation information for later analysis. When _DEBUG is not defined, calls to _CrtSetAllocHook are removed during preprocessing.

The _CrtSetAllocHook function installs the new client-defined allocation function specified in allocHook and returns the previously defined hook function. The following example demonstrates how a client-defined allocation hook should be prototyped:

int YourAllocHook( int allocType, void *userData, size_t size, int
blockType, long requestNumber, const unsigned char *filename, int
lineNumber);

The allocType argument specifies the type of allocation operation (_HOOK_ALLOC, _HOOK_REALLOC, and _HOOK_FREE) that triggered the call to the allocation's hook function. When the triggering allocation type is _HOOK_FREE, userData is a pointer to the user data section of the memory block about to be freed. However, when the triggering allocation type is _HOOK_ALLOC or _HOOK_REALLOC, userData is NULL because the memory block has not been allocated yet.
size specifies the size of the memory block in bytes, blockType indicates the type of the memory block, requestNumber is the object allocation order number of the memory block, and, if available, filename and lineNumber specify the source file name and line number where the triggering allocation operation was initiated.

References - 


A very good code which can be reused for memory detection in the applications is available at


Posted By : Xavier K Joseph

Tuesday, October 26, 2010

Loading OpenGL cg shader using Object file

Tip - While loading the cg file in OpenGL it is found that loading cg using Object file is faster than source file loading.

Details - In OpenGL a shader is loaded into GPU memory using the function 
cgCreateProgram(context, CG_SOURCE, const char *pchVertexProgramString,CG_PROFILE_ARBVP1, "main", args);

In this the second argument indicates whether the pchVertexProgramString is normal source string or whether it is pre-compiled object file. If we give the second argument as CG_OBJECT, a pre-compiled .asm file (.asm file is the assembly file generated when the cg file is compiled) and the assembly code as the next argument will reduce the time of cg compiling at the run time.

In this case the pre-compiled .asm file should be available before calling the cgCreateProgram API from our cpp files. If we are using the MakeFile for build purpose we can use the .BEFORE statement to compile cg before normal cpp files are compiled. In that case the MakeFile will look like below.

---------------------------------------------------
TARGET_DLL    = MyDll
TUSPDB=TRUE

CPP_SOURCES=\
    Stdafx.cpp \
    Source.cpp \
RC_SOURCES=\
    Resource.rc \

USER_INCLUDES=\
    -I"\Include" \

USER_DLL_LINK_FLAGS=\
    /libpath:"\Cg\Lib" \

LINK_ONLY_LIBS=\
    cg.lib \

.BEFORE:
    cgc.exe -profile fp40 Shader.cg -o Shader.asm
---------------------------------------------------

Posted By : Xavier K Joseph

Sunday, October 24, 2010

GPU Programming

Tip - GPU Programming enables us to do high performance graphics applications without using much of the critical CPU resources. Using GPU applications we can reduce the CPU utilisation to a large extend and also can achieve higher frame rates.

Details - A GPU (Graphics Processing Unit) is a processor attached to a graphics card dedicated to calculating floating point operations. A graphics accelerator incorporates custom microchips which contain special mathematical operations commonly used in graphics rendering.
A GPU implements a number of graphics primitive operations in a way that makes running them much faster than drawing directly to the screen with the host CPU.

GPU programming mainly focus on parallel processing while traditional CPU programming is based on the time scheduling of CPU. Parallel algorithms running on GPUs can often achieve up to 100x speedup over similar CPU algorithms, with many existing applications for physics simulations, signal processing, financial modeling, neural networks, and countless other fields. Now days GPU Programming is widely used to achieve parallel processing of non graphics data also. The main GPU based programming techniques that we use are Microsoft DirectX and OpenGL.

References -
http://en.wikipedia.org/wiki/GPGPU
http://www.vis.uni-stuttgart.de/vis03_tutorial/weiskopf_intro_hw.pdf

Posted by - Xavier K. Joseph

Friday, October 22, 2010

Parallel Workstation Extreme

Tip - Parallels Workstation Extreme is a virtualization platform that enables end-users to experience dedicated host graphic and networking resources in a virtualized environment.

Details - Parallels Workstation Extreme is a software product that enables to create virtual machines on any PC with a 1.66 GHz (minimum) Intel® processor with the Intel VT-x hardware virtualization technology support. If the host computer has an Intel VT-d chipset and an additional PCIe video adapter (except for the one used by the host computer) in its configuration, we can add this video adapter to the virtual machine. The virtual machine will directly access this video adapter without using the resources of the primary OS. Before adding a video adapter to the virtual machine, it should be assigned to the virtual machines in the Intel VT-d pane of Parallels Workstation Extreme Preferences.

Like other virtualization software, Parallels Workstation Extreme uses a hypervisor [See previous posts] to grant its virtual machines’ direct access to the host computer’s hardware. Previously, users could not virtualize these kinds of high-end graphics programs because virtualization did not support the program’s hardware requirements such as dedicated graphics cards, large allocations of memory, and multiple CPUs. To let users virtualize these resource-intensive programs, Parallels partnered with Intel and NVidia and incorporated their technologies into Parallels Workstation Extreme.

References - 

Posted by - Shiju CK

Wednesday, October 20, 2010

Useful WinDbg Commands

Tip - Introducing some useful commands for analyzing crash dump files in WinDbg.

Details - WinDbg (Windows Debugger) is a powerful Windows-based debugging tool for user-mode and kernel-mode debugging. Following are some commands used to analyze dump files in WinDbg.


For more information about WinDbg and its commands, please refer the following links.

References - 

Posted by - Shiju CK

MultiMedia Timers

Tip - Multimedia timer services allow applications to schedule timer events with the greatest resolution (or accuracy) possible for the hardware platform.

Details - Multimedia timer services allow you to schedule timer events at a higher resolution than other timer services. Multimedia timer does not post any messages to message queues. Instead, it calls the specified callback function directly on a separate thread. Therefore, it is more accurate than the standard Win32 timer. The minimum interval that can achieve in Win32 timer is about 16 millisecond, but in multimedia timer, it is about 1 millisecond.
To use multimedia timers in your projects, you should include Mmsystem.h, and link it with Winmm.lib.
Different systems support different minimum values for the multimedia timer resolution. We can get these values like below. And we need to set the minimum resolution by calling timeBeginPeriod function.


Now that we set the resolution, let's create the timer. The multimedia timer equivalent of SetTimer, looks like this


If uPeriod_i is not in the range of the minimum and maximum event delays supported by the timer, the function returns an error. The callback function is declared like this


Eventually, we will need to destroy the timer. We can accomplish this by a call the function below,


Posted by - Shiju CK

An introduction to OpenCV

Tip - OpenCV is an open source computer vision library in C/C++. It focuses mainly on real-time image processing.

Details - OpenCV is a computer vision library originally developed by Intel and now supported by Willow Garage. It is free for use under the open source BSD license. The library is cross-platform. Basically it is a collection of C functions and a few C++ classes that implement many popular Image Processing and Computer Vision algorithms. If the library finds Intel's Integrated Performance Primitives (IPP) on the system, it will use these commercial optimized routines to accelerate itself. The library is mainly written in C. Then, OpenCV itself can be built with OpenMP support, and, starting with v2.0, OpenCV includes SSE2-optimized code, so many of the functions run significantly faster on the modern 32-bit x86 and 64-bit x64 platforms, and even faster on dual-, quad- and many-core systems.

The main features are,
1. Image data manipulation (allocation, release, copying, setting, conversion).
2. Basic image processing (filtering, edge detection, corner detection, sampling and interpolation, color conversion, morphological operations, histograms, image pyramids).
3. Motion analysis (optical flow, motion segmentation, and tracking).
4. Object recognition (eigen-methods, HMM).
5. Basic GUI (display image/video, keyboard and mouse handling, scroll-bars).
6. Image labeling (line, conic, polygon, text drawing)

References-
http://hawaiilibrary.net/eBooks/Give-Away/Technical_eBooks/OpenCVReferenceManual.pdf
http://opencv.willowgarage.com/wiki/
http://www.cs.iit.edu/~agam/cs512/lect-notes/opencv-intro/opencv-intro.html

Posted by - Shiju CK

Sunday, October 17, 2010

Using SetUnhandledExceptionFilter API

Tip - SetUnhandledExceptionFilter enables an application to supersede the top-level exception handler of each thread of a process.

Details - After calling this function, if an exception occurs in a process that is not being debugged, and the exception makes it to the unhandled exception filter, that filter will call the exception filter function specified as parameter.

Here, MyCustomFilter is a pointer to a top-level exception filter function that will be called whenever the SetUnhandledExceptionFilter function gets control, and the process is not being debugged. See the attached sample application


Issuing SetUnhandledExceptionFilter replaces the existing top-level exception filter for all existing and all future threads in the calling process. This method is useful for generating application minidumps during crash and these minidumps can be easily debugged through WinDebug.

Posted by - Shiju CK

Friday, October 15, 2010

Using Tracepoints for debugging

Tip - Using Tracepoints in Visual Studio Debugger.

Details – All programmers are familiar with break points while debugging. But sometimes during debugging it’s not possible to interrupt the program execution. The correctness of the program may affected by the delay introduced by the debugger. In such cases we can use trace points. As the name resembles break points breaks the execution of the program while trace points doesn’t (or optional). Trace points provide additional options to know the debugging information on Trace point location. This feature is available since Visual Studio 2005.

You can put the trace point as follows.

Insert Trace point

Set trace point parameters.
The dialog box itself contains how to format information with variables and other parameters.


The output will be displayed in the output window. An example is given below

IN: 20Fxn: DisplayFxn(int),Thread: 0x140C Thread2 CPU Tick:0x4EC5FE Call Stack:      TracePointSample.exe!DisplayFxn()
      TracePointSample.exe!ProcessValue()
      TracePointSample.exe!Thread2()
      kernel32.dll!76ea36d6()
      [Frames below may be incorrect and/or missing, no symbols loaded for kernel32.dll]
      ntdll.dll!77a5883c()
      ntdll.dll!77a5880f()

IN: 11Fxn: DisplayFxn(int),Thread: 0xF74 Thread1 CPU Tick:0x4EC6C9 Call Stack:      TracePointSample.exe!DisplayFxn()
      TracePointSample.exe!ProcessValue()
      TracePointSample.exe!Thread1()
      kernel32.dll!76ea36d6()
      [Frames below may be incorrect and/or missing, no symbols loaded for kernel32.dll]
      ntdll.dll!77a5883c()
      ntdll.dll!77a5880f()

PS: Please not that the interface for setting trace point may vary on each version of Visual Studio. The screenshot given above it taken from Visual Studio 2010.

Reference:
http://msdn.microsoft.com/en-us/library/232dxah7.aspx
http://codereflect.com/2009/02/12/using-trace-points-in-visual-studio-for-debugging/

Posted by - Sarath C

Thursday, October 14, 2010

How to know Windows platform support

Tip – How to know Windows platform support
 
Details – Using GetSystemInfo and GetNativeSystemInfo API

GetSystemInfo – This API can return the system information including the platform support.
GetNativeSystemInfo – If 32 bit application is running in 64 bit operating system (WOW64), the GetSystemInfo API returns the platform as 32bit. If the (32-bit) application is particular about getting the true underlying platform, we can use this API. (e.g. If we run ProcessExplorer in 64 bit Windows, the basic itself extract another EXE to take the full advantage of 64-bit OS. The original Process Explorer is 32 bit process. In this kind of situations, we can use GetNativeSystemInfo. Generally we may have to GetSystemInfo only.
Using pointer size

if(sizeof(void*) == 4 )
// 32 bit
else(sizeof(void*) == 8 )
// 64 bit
(This method is not advised. Better using the API itself)


Reference
http://codereflect.com/2010/10/09/getting-processor-architecture-in-x86-and-x64-bit-platform/
http://msdn.microsoft.com/en-us/library/ms724340(VS.85).aspx
http://msdn.microsoft.com/en-us/library/ms724381(VS.85).aspx

Posted by - Sarath C

Wednesday, October 13, 2010

How Windows 7/Vista Manage Flicker Free Drawing?

Tip – How Windows 7/Vista Manage Flicker Free Drawing?

Details – The prior version of Windows (Windows XP and 2000 doesn’t support native double buffering for drawing operations. This may cause flickering in the applications it’s drawing intensive.
In one of the previous tips we already have seen how to enable Double buffering. WS_EX_COMSPOSITED style can be used for avoiding flickering of Windows in Windows 2000 and XP. But most of the developers are using MemDC based methods for drawing. The content need to be drawn in to a bitmap and directly Blt to screen using BitBly operation, which is extremely fast and avoid flickering caused by frequent drawing operations.

Basic Details
In Windows 7, the Desktop Window Manager (DWM) manages all the Windows running in the system. DWM uses GPU available in the system. When Windows Aero is enabled, the entire desktop area is a Direct3D surface. All drawing operations are made by applications are sent directly to the offline buffer for rendering. DWM will swap this buffer to screen whenever required. Thus by default all Window operations are done through double buffering. This architecture is quite different in prior versions of Windows, where all the drawing operations are redirected to the main screen(buffer).
Even DWM handles buffered drawing, we can’t completely make sure drawings are flicker free. Microsoft has introduced buffered drawing APIs since Windows Vista. This shall be covered as an another tip. Please check this blog post, if you want to know more about double buffering and double buffering helpers in Windows Vista .
 
More DWM
To explain a bit more detailed, the Window itself being mapped as texture on the screen, the transitions on minimize maximize are handling using GPU shaders. The shaders are small programs which can control the coordinates and pixels being displayed. Since the desktop itself a 3D surface, DWM has access to all the Windows displayed on the screen. This it can effortlessly implement the new features like, aero peak, flip 3D etc. The double buffering is also provided by DWM during Window movement, repainting etc. for flicker free drawing.
The DWM double buffering methods are sometimes not compatible with real-time graphics applications and games. In this case, DWM will not do window compositing so the application can gain the desired performance and no overheads of DWM implemented double buffering. DWM also employs efficient rendering techniques called culling to avoid displaying the Windows which are not visible in the screen (minimized, small windows hidden behind other windows etc).

Posted by - Sarath C

Monday, October 11, 2010

How to Debug a child process?

Tip – Demonstrates how to debug a child process while debugging the parent process?

Details – Usually we use Visual Studio (of any version) to debug the a process. This can be done either by open the project and start debugging or attach a running process to Visual Studio. What if the debuggee (the process being debugged) is spawning another process which you may also interested to debug? Visual Studio doesn’t support this feature and we can make this happen through WinDBG. Usually developers call DebugBreak or make some purposeful exceptions to attach to debugger. But some early exceptions during the startup are hard to catch using this method.

Steps for debugging.

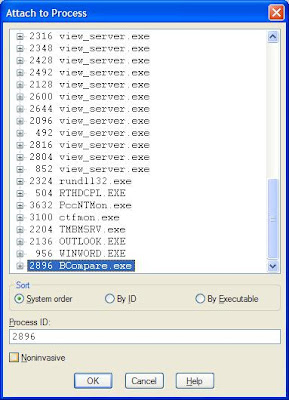
1.    Launch parent process and attach to WinDBG
2.    The execution of the attached process will be stopped and the command Window will be enabled.
3.    Enter “.childdbg 1” in command Window.
4.    Now press F5 or enter “g” command to continue operation.
5.    Whenever parent process creates the child process, it will break the execution and you can put break points or whatsoever you want to do with child process.

Below screenshots are taken by attaching beyond compare to WinDBG and just start notepad.exe from it. (This is just for the sake of an example)


NB: While debugging with WinDBG, it’s necessary to set properly symbols and source file for smooth debugging. Otherwise debugging could be a mess. For more help on debugging multiple process and processor context switch, please see the help file associated with WinDBG.

PS: We can enable a simple trick to use Visual Studio for Child Process Debugging. Create a new key under HKEY_LOCAL_MACHINE\SOFTWARE\Microsoft\Windows NT\CurrentVersion\Image File Execution Options\ and provide the debugger name as string value under this key. For Sample.exe, it may appear as below.
[HKEY_LOCAL_MACHINE\SOFTWARE\Microsoft\Windows NT\CurrentVersion\Image File Execution Options\sample.exe]
"Debugger"="vsjitdebugger.exe"

But this is not really a good method. It only a simple workaround.

Posted by - Sarath C

Folder existence checking and delete a directory tree that is not empty

Tip - Folder existence checking and delete a directory tree that is not empty

Details - _waccess function determines whether the specified file or directory exists and the mode support like read only or Read-write.


In order to delete the directory which is not empty we can't use RemoveDirectory, because it only works on empty directories/folders. But can use SHFileOperation for this.


Posted by -Sobhita Mercy E.

Wednesday, October 6, 2010

Detect memory leaks in our program.

Tip -  How can we detect memory leaks in our program.

Details -  MFC provides a structure CMemoryState to detect memory leaks in our program. This diagnostics method only help to detect memory leaks caused when memory allocated using the new operator is not deallocated using delete.

Reference -
http://msdn.microsoft.com/en-us/library/0wzsd007(VS.80).aspx
http://msdn.microsoft.com/en-us/library/2ads32e2(VS.80).aspx


Posted by - Sobhita Mercy E

Terminate all the instances of a Process through code

Tip -  How to Terminate all the instances of a Process through code

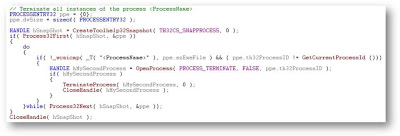
Details -  By the below shared lines of codes one can terminate all the instances of a process. CreateToolhelp32Snapshot API is used to take the snapshot of all the processes and threads in the system. The process which is to be terminated is identified from the snapshot using the Process Name. Then the process object is accessed using OpenProcess API and terminated using TerminateProcess(). The CreateToolhelp32Snapshot API not only takes a snapshot of the processes, but also the heaps, modules, and threads used by the processes.


Posted by - Sobhita Mercy E

Monday, October 4, 2010

Prefer CreateFile API with FILE_FLAG_DELETE_ON_CLOSE for temporary files

Tip - Prefer CreateFile API with FILE_FLAG_DELETE_ON_CLOSE for temporary files.

Detail - The CreateFile API call accepts several flags which affect how a file is created or opened. One of these flags, FILE_FLAG_DELETE_ON_CLOSE, specifies that the file will be deleted when the last handle to it is closed. A common activity for applications is to create temporary files. If the application terminates abnormally, these files may not be deleted, potentially wasting of disk space. But if CreateFile API is called with FILE_FLAG_DELETE_ON_CLOSE that deletes the file when all handles to it are closed, which will be perfect for temporary file scenarios.

Reference -http://msdn2.microsoft.com/en-us/library/aa363858.aspx


Posted by - Sobhita Mercy E

Sunday, October 3, 2010

How to take Call graphs in VC6


Tip -  How to take Call graphs in VC6

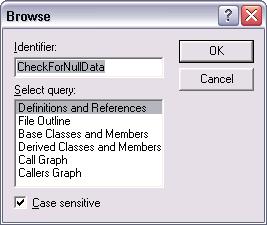
Details - Position the cursor over any function name and hit ALT+F12. If your project was built with browse-information, a dialog will appear asking what you want to do. Select CallGraph to view a hierarchy of all sub-functions which are called by your function. This is a very useful feature often overlooked in Visual Studio. The below showed dialog is of source browser which will appear when we hit ALT+F12. The same can also taken from Menu->Tools->Source Browser.


It has several modes of operation other than Call Graph or Caller Graph which will be useful.


Posted by - Sobhita Mercy E